Konna published his comment statistics and thoughts (German) on Thursday – and I thought I could present a few numbers, too.
Now my blog can’t keep up with his regarding the number of comments1, but anyway: There are 3723 entries stored in the comment database that are not spam – including
- 2039 real visitor comments (including 46 anonymous2),
- 435 trackbacks/pingbacks,
- that’s a total of 2474;
- 1249 comments by me.
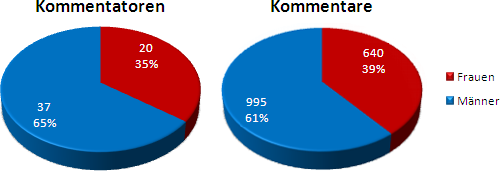
Like Konna, I’ll now look at the distribution between men (“Männer” in the graphics) and women (“Frauen”) who gave at least five comments – left: commentators, right: comments:

37 men (64.9%) wrote 995 comments (60.9%), that’s an average of 26.9. And 20 women (35.1%) wrote a total of 640 comments (39.1%), average 32.
We see: More men wrote more comments in total, but each woman wrote more than each man.
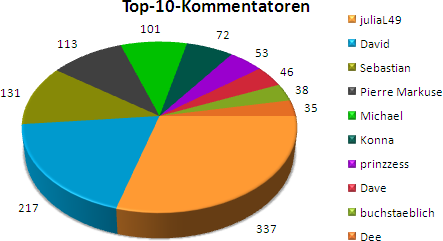
The Top 10:

Funny that Konna is here at position 6 just as I am at his. ![]()
In total, there were 78.4 comments per month (or 95.2 if I include trackbacks like Konna did) and 2.6 (or 3.1) per day – however, there wasn’t much going on in the first three quarters (including posts). So there were 1920 comments (94.2%!) in the past 12 months (160.0 per month, 5.2 per day; or 2289 incl. trackbacks, 190.8/month, 6.3/day) – and only 119 in the 14 months before that!
A great “commentator magnet” is, of course, my music quiz – if I ignore its 35 posts, there are only 1393 comments (without trackbacks) since the start of my blog, i.e. 53.6 per month and 1.8 per day, or 1274 in the past 12 months, i.e. 106.2 per month and 3.5 per day. (And since there are noticebly more men than woman, this explains the entire men/woman distribution.)
Still better than the average of all blogs registered at Blogoscoop – which is below 1 comment per day including those from the blog’s owners –, but there’s still room for improvement – so get writing! ![]()
For those who are interested: Show the SQL queries used here. ▼
Konna1 2008-11-01 at 12:08 136 Comments
quote
Deine Diagramme sind in der Tat schöner… darf ich fragen, mit welchem Programm du die erstellt hast? Hab nix Vernünftiges gefunden und deshalb auf die hässlichen Microsoft-Dinger zurückgreifen müssen. ^^
Hast doch aber auch ganz gute Werte, viele würden sich sicher darüber freuen. Und wie cool, dass ich bei dir auch auf Platz 6 bin.
cimddwc2 2008-11-01 at 12:16 6465 Comments
quote
Meine Diagramme sind die hübschen Microsoft-Dinger – von Excel 2007.
Das mit den Werten ist irgendwie ’ne zweischneidige Sache – einerseits bin ich froh, dass sie schon ganz gut sind und auch immer mehr werden, andererseits könnte man manchmal neidisch werden, wenn man anderswo viiiiel mehr sieht.
Konna3 2008-11-01 at 12:23 136 Comments
quote
Hmpf… vielleicht sollte ich mal Open Office ausprobieren. ^^
Michael4 2008-11-01 at 14:48 249 Comments
quote
Ich bin grün! Danke.
cimddwc5 2008-11-01 at 19:11 6465 Comments
quote
Konna, Open Office kann da auch nicht so viel wie Excel 2007.
Michael, ich hab die Farben schon möglichst passend ausgewählt.
Pierre Markuse6 2008-11-01 at 23:04 170 Comments
quote
Sieht kommentartechnisch doch wirklich super aus bei Dir Die Diagramme sind schick geworden. Von Google gibt es doch für die Darstellung solcher Statistiksachen doch auch eine API, oder?
Michael7 2008-11-01 at 23:05 249 Comments
quote
Ja hier:
http://code.google.com/apis/chart/
juliaL498 2008-11-02 at 10:33 912 Comments
quote
Ist doch ganz ansehnlich, was hier so kommentiert wird! Und wenn das komische Orange da nicht wäre, sähe es mit dem Frauenanteil noch schlechter aus, wa?!
cimddwc9 2008-11-02 at 12:03 6465 Comments
quote
Deswegen auch vielen Dank an das komische Orange.
Pierre Markuse10 2008-11-02 at 19:29 170 Comments
quote
@Michael: Danke! Werde ich mir nochmal ansehen, für manche Aufgaben bestimmt ganz interessant.